Making an HTML post using R Markdown
-
Adrian Cadena
Intro
This is a “test” post that I decided to use to show people how I create HTML-format posts using R Markdown. People can follow the source code here.
Metadata and format
This is the YAML front matter. Add this to line 1, including the --- at start and end.
---
author: "Adrian Cadena"
date: "11-22-2020"
repository_url: https://github.com/adriancm93/mixed_effects_bootstrapping

output:
  html_document:
    toc: yes
    toc_depth: '3'
    df_print: paged
  distill::distill_article:
    self_contained: no
    toc: yes
    toc_depth: 3
---
To format R code chunks, use this code add ``` at start and end:
{r setup, include=FALSE}
knitr::opts_chunk$set(
  echo = TRUE,
  message = FALSE,
  warning = FALSE,
  dpi = 600,
  tidy = 'styler'
  )
Font
This is the code I used to set the font size, right after the front matter.
<style type="text/css">
  body{
  font-size: 14pt;
}
</style>
Non-R code
To add non-R code without it being run, like I did with front matter and font matter, add ``` at the start and end of such code.
R code
You can run R code by inserting R code chunks. Refer to my source code.
You can change each block of code’s configurations by clicking on the engine icon on the top-right of the block. Show output only, show code and output, show nothing (run code), show nothing (don’t run code). If you want to show R code without running it, just use the ``` method we did earlier.
R code not to run
seasons <- 2000:2019
pbp <- purrr::map_df(seasons, function(x) {
  readRDS(
    url(
      glue::glue("https://raw.githubusercontent.com/guga31bb/nflfastR-data/master/data/play_by_play_{x}.rds")
    )
  )
})
R code to run
print("This is a code block")## [1] "This is a code block"You can print tables and plots:
Table
r <- read.csv("roster_data.csv")
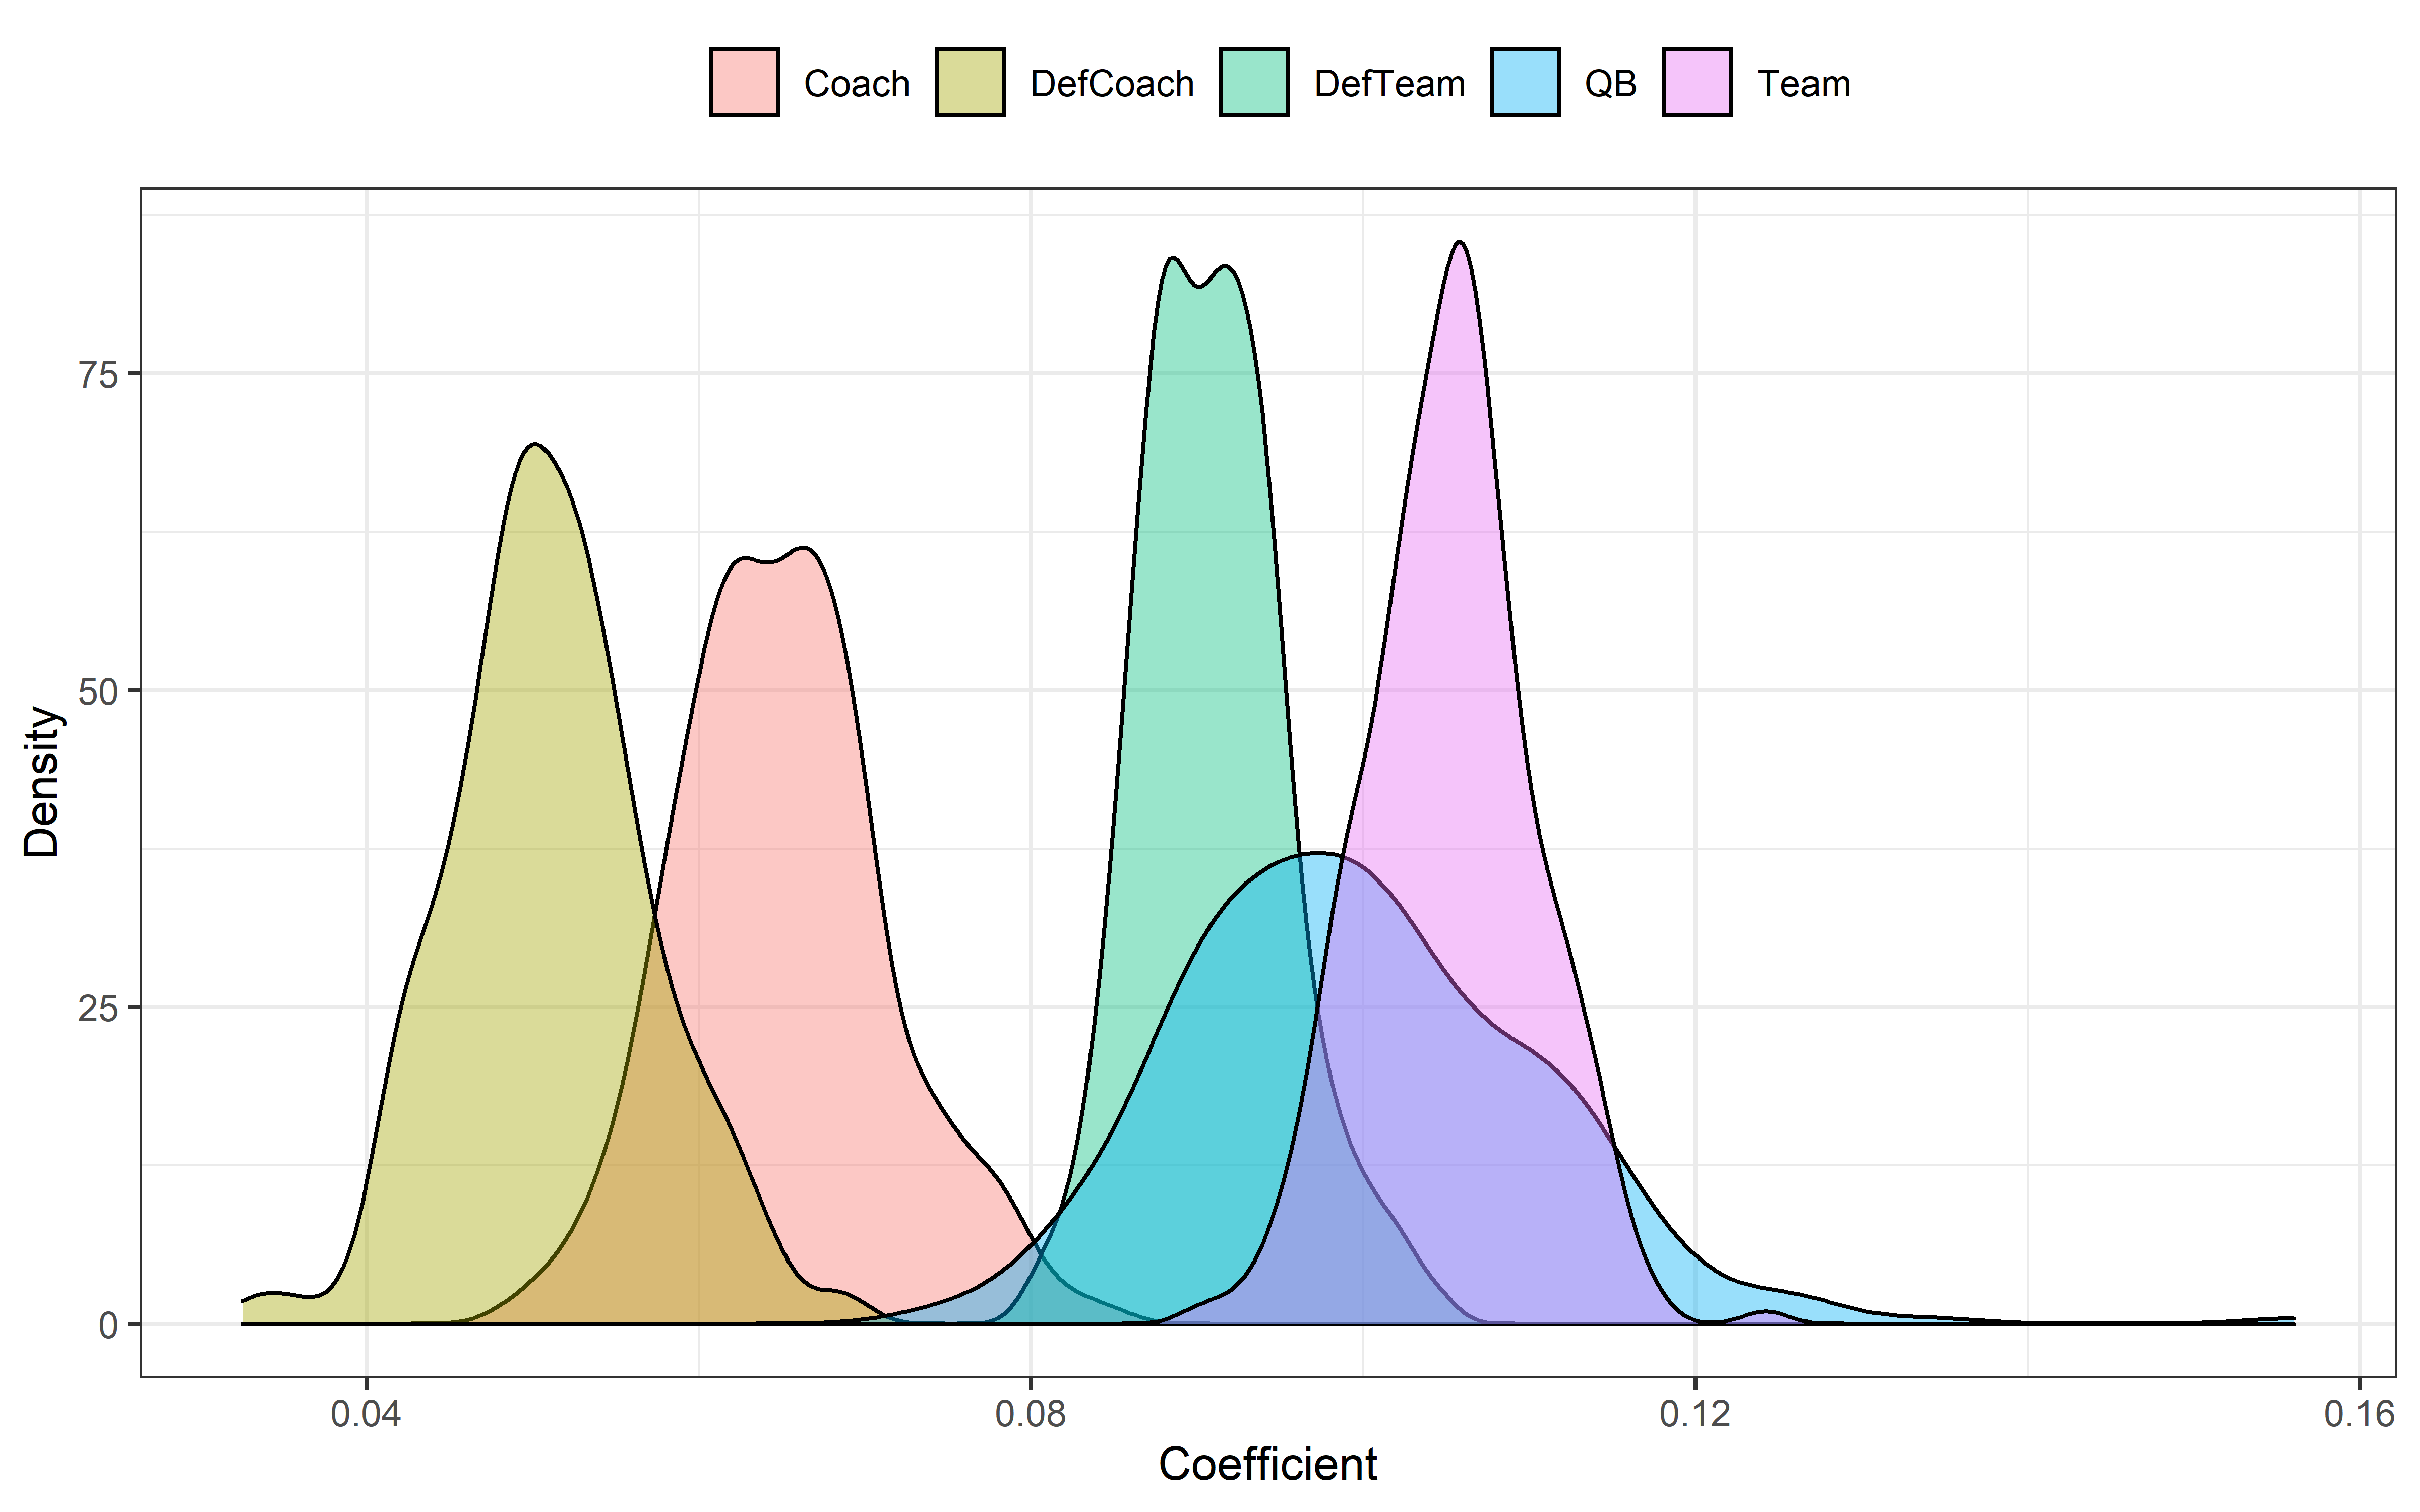
rPlots
library(ggplot2)

plot <- read.csv("analysis.csv")

p <- ggplot(plot, aes(x = coef, fill = effect)) +
  geom_density(alpha = .4) +
  theme_bw() +
  theme(
    legend.position = "top",
    legend.title = element_blank()
  ) +
  labs(x = "Coefficient", y = "Density") +
  ggsave("plot.png", dpi = 600, width = 8, height = 5, units = "in")

p
# Insert images
You can also insert images using the following code. Don’t add it to a code block.
Result: 
Convert to HTML
Click on “Knit” and select Knit to HTML.
Adrian Cadena-Medina
Data Analyst Advisor
Driving meaningful improvement by employing data science. Statistically oriented with interest in Machine and Deep Learning. My research interests include sports analytics, sustainability, and welfare economics.